SMDebug: Amazon SageMaker Debugger Client Library
Table of Contents
Overview
Amazon SageMaker Debugger automates the debugging and profiling process of machine learning training. SageMaker Debugger provides built-in features to capture output tensors, monitor system utilization, and profile ML frameworks from training jobs of your own training script and Docker containers.
You have flexibility to build customized hooks for saving training data to a storage either locally or in a cloud storage such as Amazon S3. You can also use Debugger rules - built-in or custom - to analyze the saved data, identify training issues, receive alerts, and take actions to stop training.
The smdebug client library is an open source library that powers SageMaker Debugger
by calling the saved training data from training jobs. smdebug retrieves and
filters the tensors generated from Debugger such as gradients, weights,
and biases.
SageMaker Debugger helps you develop and optimize model performance and computation. It also allows to run training jobs minimally modifying estimators, tracing training data (output tensors, system metrics, and framework metrics), catching anomalies while training models, and iteratively pruning large models.
Debugger supports TensorFlow, PyTorch, MXNet, and XGBoost frameworks.
The following list is a summary of the main functionalities of Debugger:
Run, debug, and profile training jobs of your model on SageMaker when using AWS managed containers
No changes needed to your training script if using AWS Deep Learning Containers with Debugger fully integrated
Minimal changes to your training script if using AWS containers with script mode or custom containers
Full visibility into any tensor retrieved from targeted parts of the training jobs
Real-time training job monitoring through Rules
Automated anomaly detection and state assertions through built-in and custom Rules on SageMaker
Actions on your training jobs based on the status of Rules
Interactive exploration of saved tensors
Distributed training support
TensorBoard support
See How it works for more details.
Install the smdebug library
The smdebug library runs on Python 3. Install using the following
command:
pip install smdebug
Debugger-supported Frameworks
For a complete overview of Amazon SageMaker Debugger to learn how it works, see the Amazon SageMaker Debugger developer guide.
AWS Deep Learning Containers with zero code change
Debugger is installed by default in AWS Deep Learning Containers (TensorFlow, PyTorch, MXNet) and the SageMaker XGBoost containers. The training containers are bundled and tested for integration with the SMDebug library the entire SageMaker platform.
To find a complete list of available Deep Learning Containers, See General Framework Containers in the AWS Deep Learning Container repository.
This enables you to use Debugger with no changes to your training script, by automatically adding Hook API.
The following frameworks are available AWS Deep Learning Containers with the deep learning frameworks for the zero script change experience.
Frameworks supported by the SMDebug library
The SMDebug library supports machine learning frameworks for SageMaker training jobs with script mode and custom training containers. If you want to use SageMaker Debugger with one of the following framework versions, you need to make minimal changes to your training script using the SMDebug library.
Framework |
Versions |
|---|---|
1.13, 1.14, 1.15, 2.1.0, 2.2.0, 2.3.0, 2.3.1, 2.4.1, 2.5.0 |
|
Keras (with TensorFlow backend) |
2.3 |
1.4, 1.5, 1.6, 1.7, 1.8 |
|
1.2, 1.3, 1.4, 1.5, 1.6, 1.8, 1.9 |
|
0.90-2, 1.0-1 (As a framework) |
Debugger on custom containers or local machines
You can also fully use the Debugger features in custom containers with
the SageMaker Python SDK. Furthermore, smdebug is an open source
library, so you can install it on your local machine for any advanced
use cases that cannot be run in the SageMaker environment and for
constructing smdebug custom hooks and rules.
How It Works
Amazon SageMaker Debugger uses the construct of a Hook to save the
values of requested tensors throughout the training process. You can
then setup a Rule job which simultaneously monitors and validates
these tensors to ensure that training is progressing as expected.
A Rule checks for vanishing gradients, exploding tensor values, or
poor weight initialization. Rules are attached to Amazon CloudWatch
events, so that when a rule is triggered it changes the state of the
CloudWatch event. You can configure any action on the CloudWatch event,
such as to stop the training job saving you time and money.
Debugger can be used inside or outside of SageMaker. However the built-in rules that AWS provides are only available for SageMaker training. Scenarios of usage can be classified into the following three cases.
Using SageMaker Debugger on AWS Deep Learning Containers with zero training script change
Use Debugger built-in hook configurations and rules while setting up the estimator and monitor your training job.
For a full guide and examples of using the built-in rules, see Running a Rule with zero script change on AWS Deep Learning Containers.
To see a complete list of built-in rules and their functionalities, see List of Debugger Built-in Rules.
Using SageMaker Debugger on AWS training containers with script mode
You can use Debugger with your training script on your own container
making only a minimal modification to your training script to add
Debugger’s Hook. For an example template of code to use Debugger on
your own container in TensorFlow 2.x frameworks, see Run Debugger in
custom container. See the
following instruction pages to set up Debugger in your preferred
framework.
Using SageMaker Debugger on custom containers
Debugger is available for any deep learning models that you bring to Amazon SageMaker. The AWS CLI, the SageMaker Estimator API, and the Debugger APIs enable you to use any Docker base images to build and customize containers to train and debug your models. To use Debugger with customized containers, go to Use Debugger in Custom Training Containers.
Using SageMaker Debugger on a non-SageMaker environment
Using the smdebug library, you can create custom hooks and rules (or manually analyze the tensors) and modify your training script to enable tensor analysis on a non-SageMaker environment, such as your local machine. For an example of this, see Run Debugger locally.
Examples
SageMaker Notebook Examples
To find a collection of demonstrations using Debugger, see SageMaker Debugger Example Notebooks.
Run Debugger rules with zero script change
This example shows a how to use Debugger with Zero Script Change of your training script on a SageMaker DLC.
import sagemaker as sm
from sagemaker.debugger import rule_configs, Rule, CollectionConfig

# Choose a built-in rule to monitor your training job
rule = Rule.sagemaker(
    rule_configs.exploding_tensor(),
    # configure your rule if applicable
    rule_parameters={"tensor_regex": ".*"},
    # specify collections to save for processing your rule
    collections_to_save=[
        CollectionConfig(name="weights"),
        CollectionConfig(name="losses"),
    ],
)

# Pass the rule to the estimator
sagemaker_simple_estimator = sm.tensorflow.TensorFlow(
    entry_point="script.py", #replace script.py to your own training script
    role=sm.get_execution_role(),
    framework_version="1.15",
    py_version="py3",
    # argument for smdebug below
    rules=[rule],
)

sagemaker_simple_estimator.fit()
tensors_path = sagemaker_simple_estimator.latest_job_debugger_artifacts_path()

import smdebug.trials as smd
trial = smd.create_trial(out_dir=tensors_path)
print(f"Saved these tensors: {trial.tensor_names()}")
print(f"Loss values during evaluation were {trial.tensor('CrossEntropyLoss:0').values(mode=smd.modes.EVAL)}")
That’s it! When you configure the sagemaker_simple_estimator, you
simply specify the entry_point to your training script python file.
When you run the sagemaker_simple_estimator.fit() API, SageMaker
will automatically monitor your training job for you with the Rules
specified and create a CloudWatch event that tracks the status of
the Rule, so you can take any action based on them.
If you want additional configuration and control, see Running SageMaker jobs with Debugger for more information.
Run Debugger in custom container
The following example shows how to set hook to set a training model
using Debugger in your own container. This example is for containers in
TensorFlow 2.x framework using GradientTape to configure the hook.
import smdebug.tensorflow as smd
hook = smd.KerasHook(out_dir=args.out_dir)

model = tf.keras.models.Sequential([ ... ])
    for epoch in range(n_epochs):
        for data, labels in dataset:
            dataset_labels = labels
            # wrap the tape to capture tensors
            with hook.wrap_tape(tf.GradientTape(persistent=True)) as tape:
                logits = model(data, training=True)  # (32,10)
                loss_value = cce(labels, logits)
            grads = tape.gradient(loss_value, model.variables)
            opt.apply_gradients(zip(grads, model.variables))
            acc = train_acc_metric(dataset_labels, logits)
            # manually save metric values
            hook.record_tensor_value(tensor_name="accuracy", tensor_value=acc)
To see a full script of this, refer to the tf_keras_gradienttape.py example script. For a notebook example of using BYOC in PyTorch, see Using Amazon SageMaker Debugger with Your Own PyTorch Container
Run Debugger locally
This example shows how to use Debugger for the Keras model.fit()
API.
To use Debugger, simply add a callback hook:
import smdebug.tensorflow as smd
hook = smd.KerasHook(out_dir='~/smd_outputs/')

model = tf.keras.models.Sequential([ ... ])
model.compile(
    optimizer='adam',
    loss='sparse_categorical_crossentropy',
)

# Add the hook as a callback
model.fit(x_train, y_train, epochs=2, callbacks=[hook])
model.evaluate(x_test, y_test, callbacks=[hook])

# Create a trial to inspect the saved tensors
trial = smd.create_trial(out_dir='~/smd_outputs/')
print(f"Saved these tensors: {trial.tensor_names()}")
print(f"Loss values during evaluation were {trial.tensor('CrossEntropyLoss:0').values(mode=smd.modes.EVAL)}")
SageMaker Debugger in Action
Through the model pruning process using Debugger and
smdebug, you can iteratively identify the importance of weights and cut neurons below a threshold you define. This process allows you to train the model with significantly fewer neurons, which means a lighter, more efficient, faster, and cheaper model without compromising accuracy. The following accuracy versus the number of parameters graph is produced in Studio. It shows that the model accuracy started from about 0.9 with 12 million parameters (the data point moves from right to left along with the pruning process), improved during the first few pruning iterations, kept the quality of accuracy until it cut the number of parameters down to 6 million, and start sacrificing the accuracy afterwards.
Debugger provides you tools to access such training process and have a complete control over your model. See Using SageMaker Debugger and SageMaker Experiments for iterative model pruning notebook for the full example and more information.
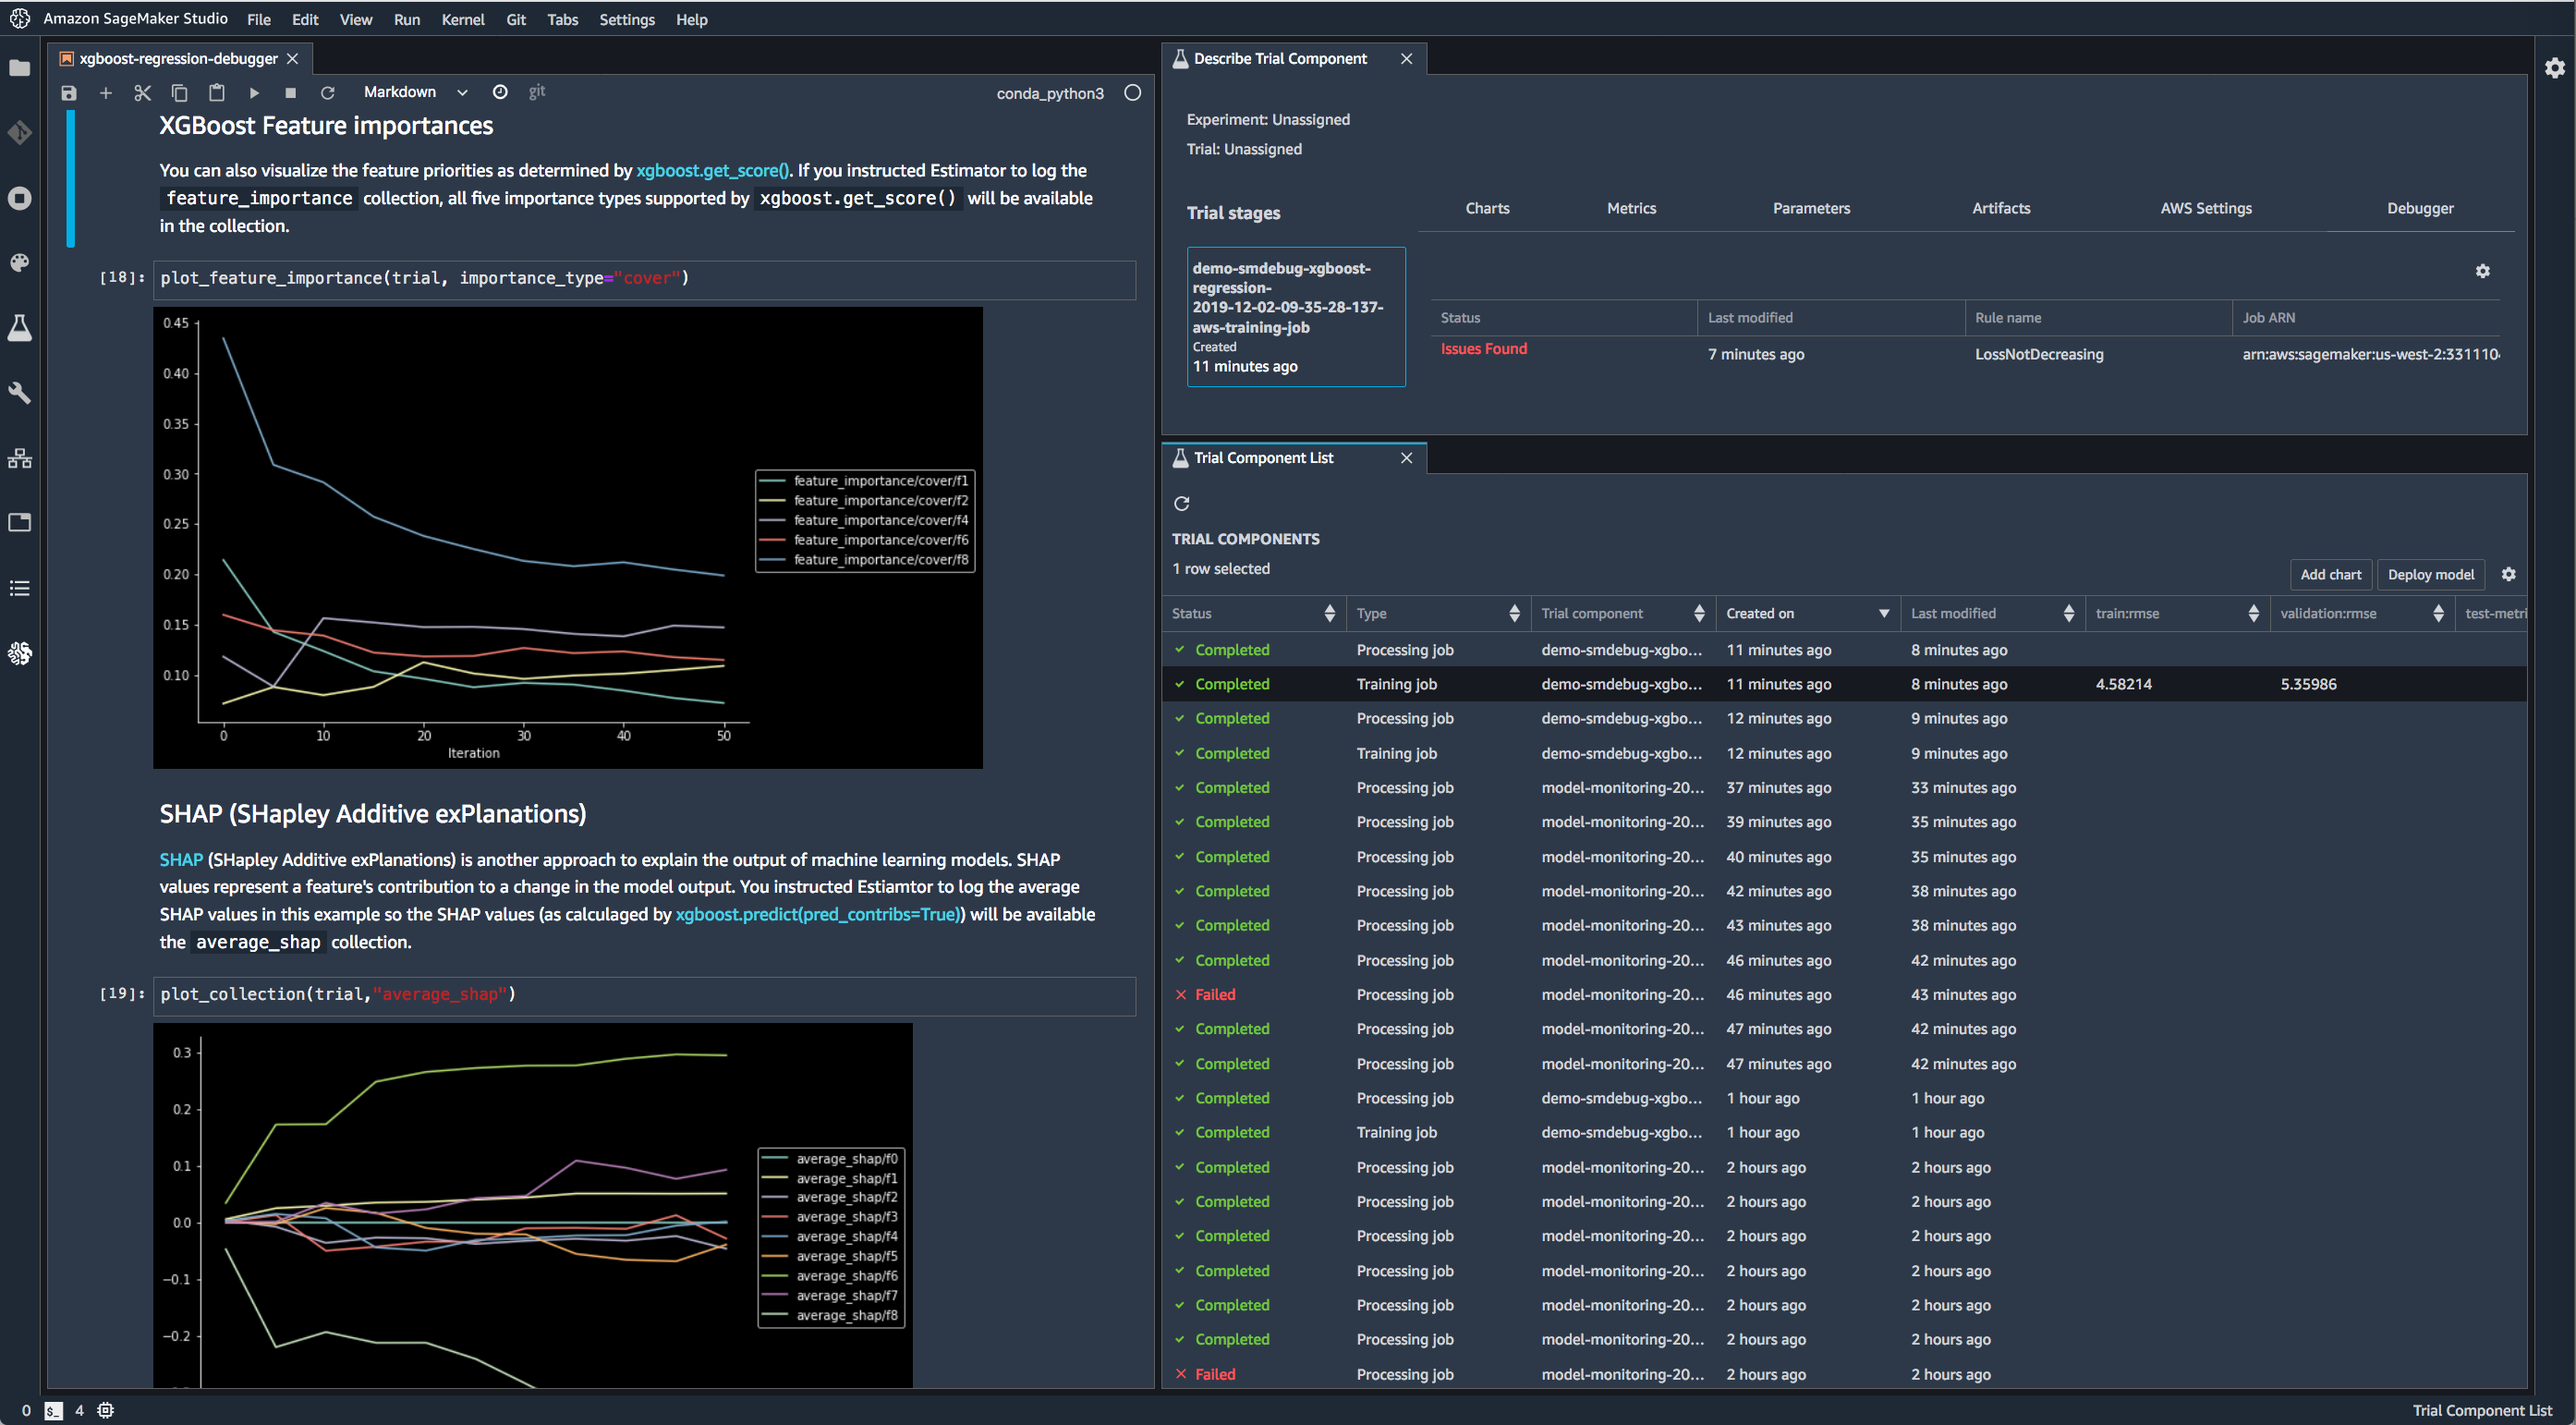
Use Debugger with XGBoost in SageMaker Studio to save feature importance values and plot them in a notebook during training.
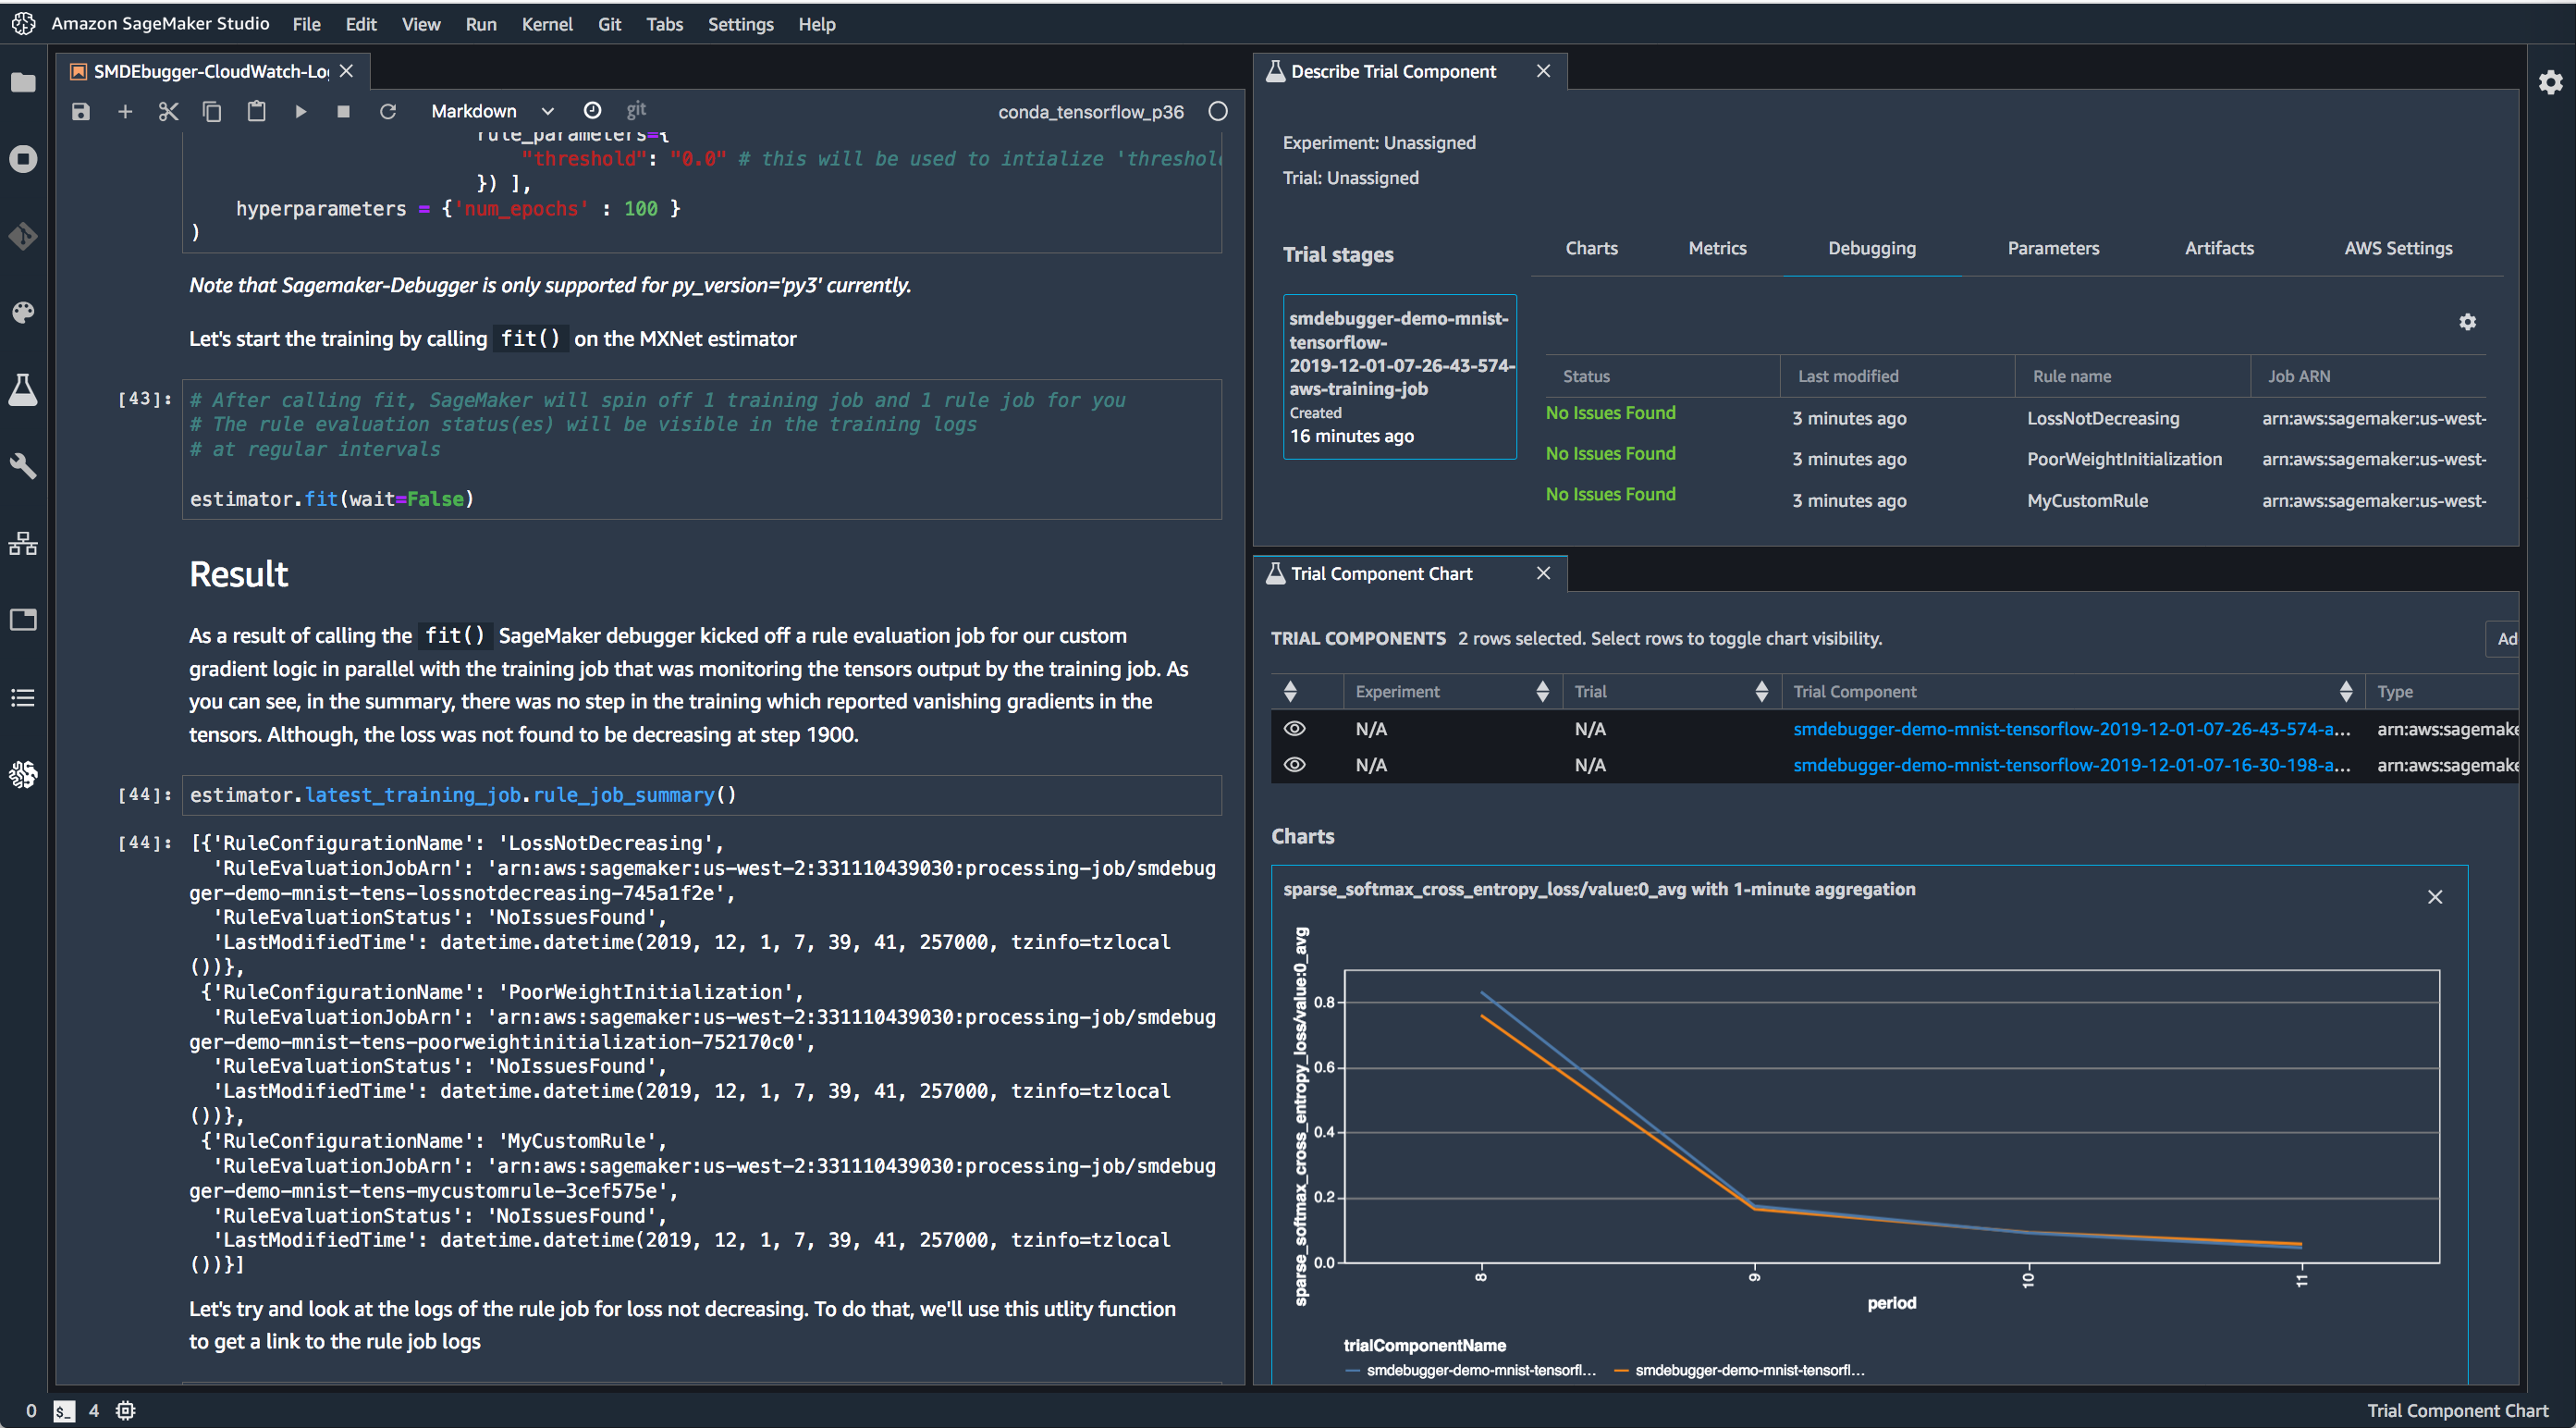
Use Debugger with TensorFlow in SageMaker Studio to run built-in rules and visualize the loss.
Further Documentation and References
Section |
Description |
|---|---|
|
See the frameworks pages for details on what’s supported and how to modify your training script if applicable. |
Full description of our APIs on saving tensors. |
License
This library is licensed under the Apache 2.0 License.